
Table of Contents


The Economics of India’s International Trade
By ISPP Research Team
Section 1. Introduction & Evolution of India’s Trade Policy
Early December 2025, the Russian President Vladimir Putin, paid a State visit to India for the 23rd India-Russia Annual Summit. The year marks the 25th anniversary of the Declaration on Strategic Partnership between India and Russia.
Leaders on both sides assessed the multi-faceted mutually beneficial India-Russia relations spanning across areas such as political and strategic, military and security, trade and investment, energy, science and technology, etc.1. The World watched how both countries reciprocated to each other’s geopolitical moves and explored new avenues for cooperation.
Leaders on both sides underlined the fact that India-Russia ties have remained resilient in the backdrop of the prevailing complex and uncertain geopolitical situation. Earlier in August, India and Russia pushed to accelerate progress on the USD 100 billion bilateral trade target by 2030, including work on the India-EAEU FTA (Eurasian Economic Union Free Trade Agreement)2.
Russia has been a longstanding partner of India since the signing of the “Declaration on the India-Russia Strategic Partnership” in October 2000 and before. It has always been a key defence supplier to India and as India attained Independence from the British rule Russia helped India set up core industries, such as the Bhilai Steel Plant (Chhattisgarh) and Bokaro Steel Plant (Jharkhand), as part of India’s industrialization drive.
While partnership with Russia has been for decades the US became India’s major trading partner only during the 1990s reforms. Although today the US is India’s largest trading partner with Indian exports like gems & jewelery, pharma, machinery, engineering goods– besides textiles & apparels and services– India-US trade evolved from limited engagement with US food aid in the 1950s-60s under the Food for Peace Program (PL-480), to help India tackle shortages in food on the one side and to sort its own agriculture surpluses on the other. Trade relations between the two countries were shrouded in India’s stance on non-alignment and protectionism till the 1990s. More recently, the trade relationship between two countries has been soured due to ongoing issues on tariffs (US has imposed as a penalty for India buying crude oil from Russia) on various commodities, visas (H-1B), and India’s data policies.
With the backdrop of two major strategic partnerships between India on one side and the former Soviet Union (USSR) and the US on the other, these partners have witnessed diplomatic attacks, counter attacks and accommodation. During the cold war period (1947-1991), India’s trade policy evolved keeping their (USA and erstwhile USSR) individual trading blocs and regional alliances into picture. In other words, political relations, diplomacy and economic arm twisting have played key roles for India in forging its strategic partnerships in trade.
1.1 Emergence of World Trade Organisation, Bilateral Trade and Self Reliance
India’s export diversification took off in the 1990s because of two reasons. India opened its economy through privatisation, liberalisation and globalisation, as also the establishment of the World Trade Organisation (WTO) in 1995. Newer destinations such as the Middle East, Africa and Southeast Asia became stronger in trade and India found itself armed with stronger negotiating powers in multilateral trade with the WTO providing it the necessary platform. Liberalisation and globalisation aided negotiations.
India’s trade history also witnessed several shifts in its export basket from dominance in spices and textile before the British rule to being a raw material supplier during the rule, to protectionism during post-independence period between 1947-1991, and finally to strategic global integration post that. Alongside merchandise also came up exports in services, which not only gave the necessary fillip to India’s exports but also led to its consistent growth.
More recently, the trade policy is shifting to bilateral and regional cooperation. This is also a period of assertion, faith in its strategy and that of its trading partners. In short, India is well placed to decide what to import, who to import from, what to export, to who to export and not get pressured by any of its trading partners.
India is firming up several bilateral trade agreements with the US, EU, the UK and Russia, besides other countries. This is a major shift from taking stance on various issues on multilateral trade negotiations such as the WTO. In sum, India is no longer a passive participant in global trade. By aggressively addressing issues such as dumping, buying crude oil from a country where the terms of trade are favourable, while also capturing high-end exports India is carving out a place for itself in global trade.
More specifically, India is also focusing on self-reliance in trade. Current phase described as that of “Strategic Autonomy” has enabled India to safeguard its sovereign decision-making while engaging simultaneously with major powers, like the United States, China, and Russia, on its own terms. It focuses on Atmanirbhar Bharat (self-reliance) by substituting critical imports like electronics and defence equipment with domestic production.
1.2 Current trade scenario
Export of merchandise in the calendar year 2024 stood at USD 442.71 billion against USD 431.42 billion in the same period in 2023 reflected a growth of 2.62%. In the top 20 commodities the growth was 2.46%3.
According to the Economic Survey 2024-25 total exports (merchandise and services) registered a steady growth of 6% in the first nine months of Financial Year 2024-25. Growth in services and merchandise exports, excluding petroleum and gems and jewellery, was 10.4% indicating that Indian manufacturing, agriculture and services exports were able to compete globally. Total imports during the same period registered a growth of 6.9%4.
According to the 2025 Year End Review by the Department of Commerce India registered a landmark achievement in external trade with total exports (merchandise and services) witnessing an all-time high of USD 825.25 billion in the Financial Year 2024–25, an annual growth of 6.05%. This momentum passed on in 2025-26 with exports rising to USD 418.91 billion during April–September 2025, an increase of 5.86% over the same period last year. According to the government this is highest ever first half (H1) export5.
India’s services sector exports achieved USD 387.54 billion in 2024–25, a growth of 13.63% growth. During April–September 2025, it registered a 9.34% increase over the same period last year at exports of USD199.03 billion6.
Interestingly non-petroleum exports surged at USD 374.32 billion, recording a 6.07% growth reflecting resilience.
Recent pushes by the Government such as the development of logistics hubs, investments in infrastructure, and policy reforms to improve supply chain efficiency are expected to drive the Indian exports sector. Directorate General of Foreign Trade’s (DGFT) ‘Trade Connect e-Platform’, a single window initiative enabled exporters to add newer markets. Another development is the rise of electronics as a dominant export category. Driven by PLI (production linked incentives) schemes, electronics exports have surged, hitting a 24-month high of $3.58 billion in December 2024.7
Section 2. Trade patterns in relation to merchandise exports
As discussed in the earlier section India’s external trade has reflected resilience over years and has withstood external shocks such as wars, for instance Russia-Ukraine and Israel-Palestine wars in recent past, protectionism and unfair tariff impositions by trading partners, for instance, US recent upto 50% tariff as a penalty for buying crude oil from Russia, besides, disruptions in global trade due to Red Sea crisis, caused by Houthi rebel attacks on commercial ships, leading to global supply chain vulnerabilities, and drought in the Panama Canal between 2022-24.
India has also been able to substantially capitalise its services exports. Its share in global services exports doubled from 1.9% in 2005 to 4.3% in 2023, its foreign exchange reserves stood at USD 640.3 billion at the end of December 20248. Further, India’s external debt to GDP ratio stood at 19% and its total FDI stood at USD 81 billion the close of FY2025.
India’s ranking in global trade changes from year to year as per WTO. In 2023, India was ranked number 12 exporter globally in merchandise. Between 2018-2023 total exports of India have increased by USD 115 billion from USD 341 billion in 2018 to USD 455 billion in 2023.9
India exhibited a Trade Intensity Index score of greater than 1 with 84 countries which accounted for 67% of its exports in 2023. TII indicates whether a country exports more, as a percentage, to a trading partner than the world does on average. Moreover, India shows a revealed comparative advantage (RCA > 1) in 43 commodities constituting 68% of its merchandise export portfolio10. A particular country is said to have a revealed comparative advantage in a given product, say, i when its ratio of exports of product i to its total exports of all products exceeds the same ratio for the world as a whole.
According to government data, India’s merchandise exports was estimated at USD 437.70 billion, while imports reached USD 720.24 billion in FY 2024-25. During this period, the United States ranked as India’s largest export destination at USD 86 billion followed by UAE at USD 36 billion, and China serving as the largest source of imports at USD 113 billion followed by Russia at 0.6 billion11.
2.1 India’s Top 5 Export Commodities (FY25)12
| Rank | Commodity | Value ($Bn) | % Share of Total Exports |
| 1 | Engineering Goods | 116.67 | 26.67% |
| 2 | Petroleum Products | 63.34 | 14.50% |
| 3 | Electronic Goods | 38.57 | 8.81% |
| 4 | Drugs & Pharmaceuticals | 30.46 | 6.97% |
| 5 | Gems & Jewellery | 29.81 | 6.82% |
2.2 India’s Top 5 Export Destinations in FY2513
| Rank | Country | Export Value ($Bn) | % Share of Total Exports |
| 1 | United States | 86.51 | 19.78% |
| 2 | United Arab Emirates | 36.64 | 8.37% |
| 3 | Netherlands | 22.76 | 5.20% |
| 4 | United Kingdom | 14.55 | 3.33% |
| 5 | China (P.R.) | 14.25 | 3.26% |
2.3 India’s Top 5 Import Commodities (FY25)14
| Rank | Commodity | Value ($Bn) | % Share of Total Exports |
| 1 | Petroleum & Crude products | 185.80 | 26.00% |
| 2 | Electronics goods | 98.72 | 13.71% |
| 3 | Gold | 58.00 | 8.00% |
| 4 | Machinery, electricals/non electricals | 53.55 | 7.71% |
| 5 | Transport equipment | 33.15 | 4.60% |
Note: Petroleum fuels and oils were estimated to be around 31.4% of India’s total imports by 2025. Around USD 186 billion came from petroleum products alone.
2.4 India’s Top 5 Importing countries in FY2515
| Rank | Country | Export Value ($Bn) | % Share of Total Exports |
| 1 | China | 113.46 | 15.75% |
| 2 | Russia | 63.84 | 8.86% |
| 3 | United Arab Emirates | 63.42 | 8.81% |
| 4 | USA | 45.33 | 6.29% |
| 5 | Saudi Arabia | 30.12 | 4.18% |
2.5 Emerging Merchandise export trends over the years
As discussed in earlier sections India’s trade composition has undergone pronounced transformation since the early-1990s liberalisation when India opened its trade frontiers. The second wave of reforms came in early 2000s (2002-2011), which witnessed diversification from a basket of primary commodities to higher-value goods such as refined petroleum products, drug formulations, precious stones and electronics. This is the phase when India also intensified and broadened its destinations to cover emerging economies in Asia and Africa.
India’s merchandise exports have grown by 39% between 2013-14 and 2023-24, driven by a stronger manufacturing base, diversification and increased global demand.
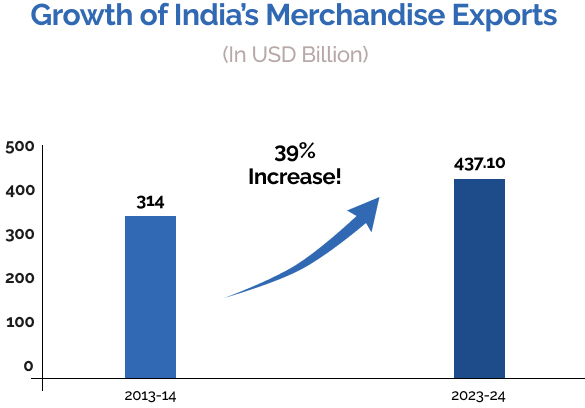
Source: Press Information Bureau
2.6 Leading Export Regions Over the Years
In 2004-05, India largely exported to North America, the European Union, North-East Asia, West Asia-Gulf Cooperation Council, and ASEAN. These intensified in 2013-14. By 2023-24, exports showed continued growth with that to North America as also ASEAN region by five to six times from 2004-0516.
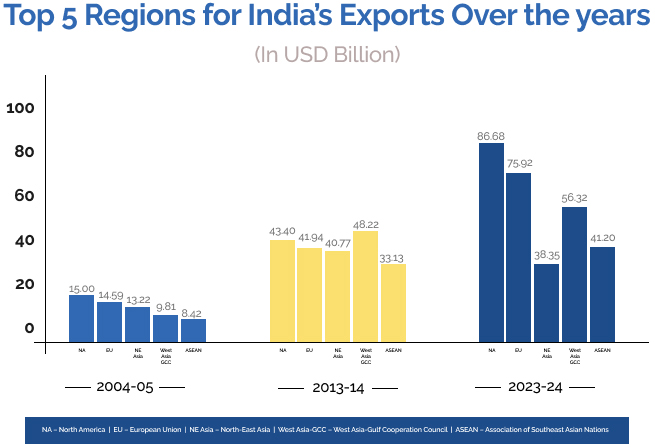
Source: Press Information Bureau
Section 3. Evolution of trade patterns in relation to services
India’s services sector has been fuelling growth both domestically and globally. The sector is the largest contributor to India’s GDP, comprising over 50% driven largely by IT, finance, trade, and tourism. In trade, the services sector has gone a long way strengthening India’s external trade imbalance.
India’s share in global services exports has been steadily rising over the last two decades. This has helped in containing shocks due to fluctuation in merchandise exports owing to several reasons such as war, natural calamities or unfavourable bilateral terms of trade. For instance, the services exports largely remained unaffected under the US tariff threats on India, which affected sectors such as textiles, gems, jewellery, auto parts, etc, when tariffs were increased to 50% in August, 2025.
3.1 Surging services exports
India’s services exports are a key part of India’s growth story. Exports in this sector have more than doubled in the past decade, reaching a record high of $387.5 billion in FY2025. While IT and BPM (Business process management) continue to lead, financial, professional, and digital services are gradually broadening India’s global presence17.
The figure below reflects a 124% growth of services sector between 2013-14 and 2023-2418.
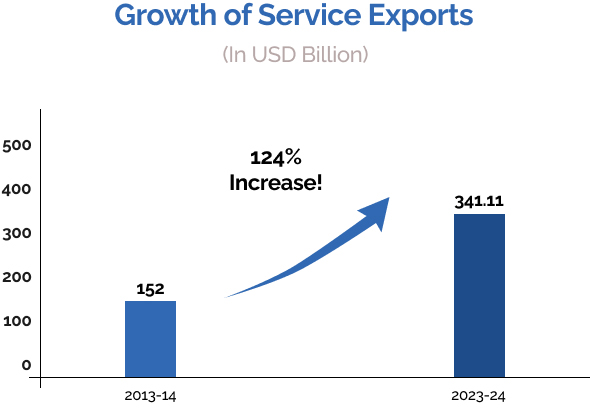
Source: Press Information Bureau
India’s key export destinations include USA & Canada which are importers of Indian software, IT, and IT-enabled services (ITeS). The UK, Germany, and other European nations are significant buyers of Indian tech and business process services while Japan, Hong Kong, and Singapore are other key markets. US, Canada and the UK contribute to over 50% of services exports from India19. Besides, IT-BPO/ITES where India is a leading global exporter, professional services, finance, healthcare and logistics and transport also contribute significantly.
3.2 Rising share in global trade
The chart below illustrates the rising share of India’s services sector between 2005 and 2023, besides the pace at which services exports are rising vis-à-vis export of merchandise. Services sector exports more than doubled between 2005 and 2023.
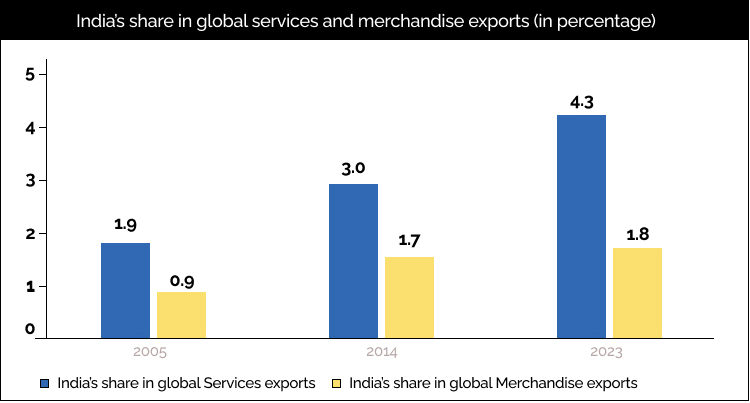
Source: United Nations Conference on Trade and Development
As per Economic Survey 2024-25, post-pandemic, services exports have maintained a steady momentum and accounted for 44% of India’s total exports in FY 2023-24. In 2023, the US led global services exports with 13%, followed by the UK with 7.4%, Germany with 5.5% and Ireland, China, and France, each accounting for around 5%. India ranks seventh globally, representing a 4.3% share in the global services export20.
Computer services and business services exports account for around 70%. India remained amongst the top five major countries in terms of growth in services exports in FY25 (April-September)21
3.3 India’s Comparative advantage and significant contribution in bilateral trade
India’s services accounted for over 10.20% of the world’s services exports in IT services and 7.16% in other business services in 202322. India also shows a stronger RCA (RCA>1) in IT and other business services. According to NITI Aayog there is significant potential for Indian service exporters in travel, transport and financial services to expand their presence in major export markets such as the USA, Germany, the UK, Ireland, Netherlands, etc23. Other business services include business and management consulting, public relations, engineering services, advertising, trade fair services, and various technical services, including scientific and space-related services.
India’s efforts to enhance bilateral FTAs include a component of the services sector. Some of the key measures aimed at boosting service exports are as follows 24:
- India-UAE CEPA 2022: This agreement allows Indian service providers the opportunity to export 100 out of 160 service sub sectors, broadly including services across financial, insurance, tourism business and construction25.
- India-EFTA Trade and Economic Partnership Agreement 2024: with Switzerland, Norway, Iceland, and Liechtenstein, focusing on enhancing trade in financial, telecommunications, insurance and banking services26.
- India Australia Economic Cooperation and Trade Agreement 2022: provides the opportunity to export 135 service sub sectors to, covering business services, communication services, construction and related engineering services27.
- India-UK CETA 2025: The agreement includes a wide-ranging package covering Information Technology /IT enabled services, financial and professional services, business consulting, education, telecom, architecture, and engineering that will unlock high-value opportunities and job creation. India exported over USD 19.8 billion in services to the UK in 2023, and CETA has the potential to expand this further28.
- India- Eurasian Economic Union (EAEU) FTA: With around USD1 billion services trade in 2021 with focus is on boosting IT, tourism, transport the treaty aims to boost services/goods bilateral trade at USD 100 billion trade by 2030 29.
3.4 Services role in value addition
The rapid technology-driven transformation of service delivery and the diversification of India’s services exports have been showing steady trends. There is also growing literature emphasising the ‘servicification’ of manufacturing, i.e., increasing utilization of services in manufacturing production and post-production value addition. Servicification, primarily, is the use of services as intermediate inputs as also add-ons to enhance the competitive advantage of manufactured products30.
Section 4. Dependence on Crude oil and India’s trade deficit
India’s trade deficit stems from its high dependence on imported crude oil which is over 80% of its requirements. Gold, electronics, and machinery are other high value imports.
4.1 Key factors for increasing India’s Trade Deficit:
- Crude oil: India imports over 80% of its crude oil, making it vulnerable to global price volatility.
- Gold imports: Demand for gold, especially for jewelery and investment purposes
- Electronics and machinery: Shortages in domestic production of semiconductors and hardware necessitate imports.
- Rising Domestic Consumption: Increasing middle-class incomes boost demand for imported consumer goods, thus adding to import bills. Increased reliance on imported intermediate goods and finished products.
- Rupee Depreciation: A weaker Indian Rupee makes imports more expensive.
- Slowing merchandise export growth: This happens due to various reasons that include wars, worsening political relationship with trading partners, natural calamities, higher tariffs by trading partners on India’s export etc.
India’s merchandise imports soared to an all-time high of USD 76 billion in October 2025, a year-on-year growth of 16.6%. This was largely due to surge in gold imports likely aided by festive season demand as also speculative/investment demand, besides growth in non-oil non-gold items. In contrast, merchandise exports witnessed contraction of around12%31. Exports to US fell by 8.6% in October 2025.
All these resulted in the merchandise trade deficit at USD 41.7 billion in October 2025, over October 2024. While the trade deficit is expected to lower in November-December 2025 it will affect the quarter’s deficit in Q3 FY2026.
The chart below reflects trade imbalances between 2023-2432.
Trade deficit during FY 2023-24 (April-March)
| 2023-24 (USD billion) | 2022-23 (USD billion) |
||
| Merchandise | Exports | 437.06 | 451.07 |
| Imports | 677.24 | 715.97 | |
| Services* | Exports | 339.62 | 325.33 |
| Imports | 177.56 | 182.05 | |
| Overall Trade (Merchandise+ Services)* | Exports | 776.68 | 776.4 |
| Imports | 854.8 | 898.01 | |
| Trade Balance | -78.12 | -78.12 |
* The data for March 2024 was an estimation
Source: Press Information Bureau
4.2 Export push to narrow deficit
Over the ten-year span from 2013–14 to 2023–24, total exports (merchandise + services) climbed by about 67%, yet the composition of imports changed much less, leaving India’s trade with recurring trade vulnerabilities33.
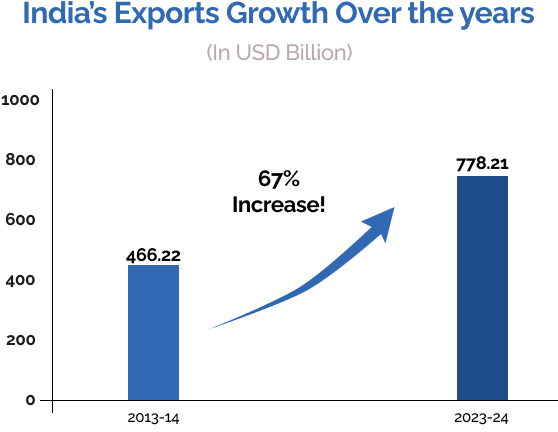
Source: Press Information Bureau
Section 5. Trade liberalisation, multilateral and bilateral trade
Liberalization Shift in 1990s
Before India’s 1991economic reforms India laid high tariffs, besides multiple and complex systems of control prevailed on both imports and exports, as also exchange rate controls34. In other words, “ease of doing business” was not a priority. Trade policy was considered as a tool of industrial protection35.
Post liberalisation, several tariff and non-tariff measures were taken where peak tariffs on import were reduced from over 300% to about 150% and the quantitative restrictions (QRs) were replaced by price-based import mechanisms36. All QRs on imports of manufactured consumer goods and agricultural products were fully removed by April 2001. Besides, imports of several capital goods and intermediate goods were made free. The process of lowering customs duties continued in the Budgets of subsequent years. The government also permitted setting up trading houses with 51% of foreign equity to boost exports. investment (FII)37. Besides, the rupee was made partially convertible on the current account in 1991.
The allowance of 100% FDI under the automatic route in India’s automotive sector raised India’s attractiveness to investors, making it a compelling destination for a global automotive hub. Stemming from the liberalisation era of 1990s 100% FDI was allowed in India’s automotive sector under the automatic route with the National Auto Policy of 2002, which removed previous caps and minimum investment rules.
5.1 FDI in automotive sector
FDI equity inflow in the Automobile Industry Sector during January 2000 to December 2024 was worth USD 37.68 billion comprising 5.23% of the total FDI equity inflow. Japan, US, Singapore, Switzerland and Germany were the top countries contributing to equity inflow38.
Today India is a major hub for passenger vehicle manufacturing, with facilities in Chennai, Pune, Gurugram, Gujarat, and Karnataka, with investments from players like Toyota, Suzuki, Honda, Hyundai, Tata Motors, and Maruti Suzuki.
However, India has stringent conditions foreign automotive players before they can make India their hub.
5.2 A Case study of Tesla
Elon Musk’s electric vehicle (EV) company is braving high tariffs and stiff competition in India’s nascent but rapidly expanding EV market. Tesla’s launch in July 2025 with its first showroom in Mumbai and start of sales with the Model Y has been amidst high import duties (70-100% imposed on completely built units) as also competition from local players, besides infrastructural constraints.
In line with the Indian government’s policy Tesla’s strategy for India includes a proposed manufacturing plant with an annual capacity of 500,000 vehicles at an investment of $2-3 billion. Tesla has also indicated its intent to launch an affordable model priced between ₹20-25 lakh to appeal to Indian consumers.
The company’s earlier attempts to enter India have faced regulatory and tariff-related challenges. Tesla could have benefited from the Indian government’s new EV policy of March 2024, under which automakers investing at least $500 million in local manufacturing can import upto 8,000 vehicles annually at a reduced 15% import duty. The policy also sets a three-year timeline to set up manufacturing facilities and start commercial production, with a goal of achieving 50% domestic value addition within five years.
To ensure the progress of the domestic manufacturing ecosystem, the Indian government opened an avenue via its PLI scheme, encouraging foreign auto companies to localise production. Then there’s the other flagship scheme Faster Adoption and Manufacturing of Hybrid and Electric Vehicles (FAME), which too offers impetus to EV sales with state governments contribution.
India is much behind the US and China in EV vehicles and China has now emerged as the leading EV market. This is the time global electric companies can make major headway in the Indian market.
However, despite a promising market Tesla’s foray in India has been low key. This is quite different from other large MNCs like Apple, Microsoft, Amazon and Google, which saw the respective billionaire bosses coming down to India to script history. Tesla’s limited number of model launches and their pricing at over Rs 60 lakh each makes its India journey uninspiring. Currently, Tesla imports fully assembled vehicles into India, which are subject to 70-100% import duties.
India has a fast-growing auto market and ranks amongst the first five global vehicle producing countries. Besides, Government schemes like FAME, PM E-Drive (Electric Drive Revolution in Innovative Vehicle Enhancement), and PLI have mobilized ₹66,000+ crore to support EVs and localization39.
One reason that’s deterring potential buyers and therefore prospective manufacturers, including Tesla, is the fact that fast-charging solutions remain scarce. Currently, India has only one public charging station per 135 EVs, significantly lower than the global average of one station for every 6-20 EVs, according to CareEdge research report. Also, India imports over 90% of the EV batteries, which makes the end product expensive and also makes the EV industry vulnerable to supply shocks.
In the Indian market Tesla is also facing competition with Chinese BYD. While Tesla is starting with premium CBU imports (Model Y), BYD has already established with localized models (like Sealion 7, Atto 3). In sum, Tesla faces high duties, while BYD navigates policy hurdles for local manufacturing, and has learnt to thrive in the Indian market.
5.3 India and WTO
Post-liberalisation India joined the World Trade Organization (WTO) in 1995, as a founding member. WTO replaced the General Agreement on Tariffs and Trade (GATT) of which India had been a member since 1948. The WTO has played a key role providing a multilateral platform and a transnational trade institution which has helped ease accommodations, has led to disagreement resolution, and has established trade rules amongst its member nations.
India’s role particularly spans some critical areas as discussed below:
- Agricultural Negotiations: India has been a strong advocate for reforming agricultural trade rules to address disparities between developed and developing nations particularly in subsidies and market access. It called for fairer system limiting excessive subsidies provided by developed nations to their farmers and successfully defended its right to maintain reserves of food grains and provide subsidies for food security purposes40.
- Trade in Services: India actively supported mutual recognition agreements to enhance the mobility of professionals, thereby expanding its service exports, which has paid off.
- Intellectual Property Rights (IPR): The Agreement on Trade-Related Aspects of Intellectual Property Rights (TRIPS) was a contentious issue for India. While recognizing the importance of intellectual property (IP) protection for innovation, India advocated the need to balance IP rights with public health concerns. Besides, it focused on protecting its traditional knowledge and biodiversity, while advocating for measures that prevent biopiracy41.
- In the process India has established a leadership position under WTO with respect to42:
- G-33 Grouping, a coalition of developing countries that works for the interests of farmers and promotes food security
- Global South Leadership: by aligning with other emerging economies, advocating for addressing the needs of developing nations
- South-South Cooperation: India’s initiatives in promoting trade relations among developing countries through fostering trade agreements
5.4 From regional trade to bilateral trade agreements
India has also prioritized regional trade through agreements such as the Asia-Pacific Trade Agreement (APTA), a regional pact for tariff reduction and economic cooperation among nations such as India, China, Korea, Bangladesh, Sri Lanka, and Lao PDR (Mongolia joined later). And through SAPTA (SAARC Preferential Trading Arrangement) amongst South Asian nations to promote trade by reducing tariffs, aiming for a Free Trade Area (SAFTA).
More recently, India has several bilateral trade tie-ups with several of its trading partners which includes developed and developing countries. Such negotiations between two trading partners help in focussed trade negotiations and chart out future course of action.
The following table gives regional trade partners country/region wise details besides measuring the outcomes.
India’s exports – RTA Partner Countries/Region wise
| India’s RTA partner Countries/region | Names of RTAs | Export in 2011 | Export in 2021 |
| ASEAN | India-ASEAN FTA India-Singapore CECA India-Malaysia CECA India-Thailand FTA – Early Harvest Scheme (EHS) |
34.5 | 40.6 |
| Japan | India-Japan CEPA | 5.6 | 6.1 |
| South Korea | India-South Korea CEPA | 4.6 | 7.0 |
| SAFTA | Agreement on SAFTA India-Sri Lanka FTA India-Nepal Treaty of Trade India-Bhutan Agreement on Trade, Commerce and Transit |
13.0 | 31.6 |
| Mauritius | India-Mauritius Comprehensive Economic Cooperation and Partnership Agreement (CECPA) | Early to calculate quantifiable benefits as it was implemented only w.e.f. 10.04.2021. | |
| United Arab Emirates | India-UAE CEPA | Early to calculate quantifiable benefits as it was implemented only w.e.f. 01.05.2022. | |
| Australia | India-Australia Economic Cooperation and Trade Agreement (Ind-Aus ECTA) | This RTA has been signed on 02.04.2022, early to calculate quantifiable benefits | |
Source: Directorate General of Commercial Intelligence and Statistics (DGCI&S)
More recently, India concluded a Comprehensive Economic and Trade Agreement (CETA) with the United Kingdom in 2025. CETA provides an unprecedented duty-free access to 99% of India’s exports to the UK, covering nearly 100% of the trade value, benefiting sectors such as textiles, leather, marine products, gems, engineering goods, chemicals, and auto components43.
Also under this agreement, mobility for professionals across IT, healthcare, finance, and education is being eased with CETA.
In its first FTA with four developed European nations, India signed a trade and economic partnership agreement with the EFTA countries- Switzerland, Norway, Iceland, and Liechtenstein- in 2024. The agreement improves market access for Indian pharmaceuticals, engineering goods, and services, strong investment commitments, including USD 100 billion in investment 44.
India’s Comprehensive Economic Partnership Agreement (CEPA) with the United Arab Emirates, signed in 2022, has substantially reduced tariffs on over 90%of Indian exports- particularly in gems and jewellery, textiles, leather, and engineering goods, which supports the target of exceeding $100 billion in bilateral trade45.
Australia, India concluded the Economic Cooperation and Trade Agreement (ECTA) in 2022, eliminating or reducing tariffs on most traded goods. The agreement has opened the Australian market to Indian textiles, pharmaceuticals, chemicals, and agriculture.
In Africa, India signed its first trade pact with the continent through the Comprehensive Economic Cooperation and Partnership Agreement (CECPA) with Mauritius in 2021. This enables easier market access for Indian exporters and creates Mauritius’ role as a gateway to African markets.
Several major economies are currently engaged in active negotiations with India through FTAs and comprehensive economic partnerships.
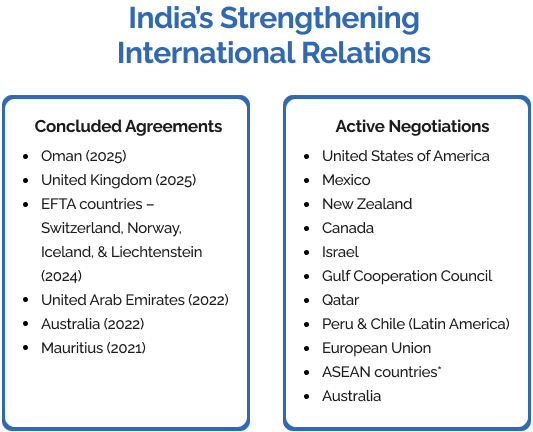
Source: Press Information Bureau
Section 6. US Tariffs and India’s Resilience
In 2025, the United States announced sweeping reciprocal tariffs on a range of Indian exports, which has led to trade imbalances and unfair practices as the tariff was as high as 50% for India on a wide range of goods. The reason cited by the US was because India is importing crude oil from Russia.
These measures have created short-term market shocks for Indian exporters and prompted India to engage diplomatically and consider retaliatory options under WTO rules. Market Diversification to reduce dependence on US and domestic resilience through local products are some measures being adopted by India.
Besides, the ongoing FTA negotiations with the EU, the UK, and other partners offer an opportunity to secure deeper market access, integrate into global value chains, and position India as a reliable manufacturing and sourcing hub.
Section 6: Conclusion
To sum up, India’s exports have risen substantially since the economic reforms started in 1991 leading to liberalisation of trade, services exports have further provided a boost and more recent phenomena including value-added servicifation of manufacturing can be a potential area of export growth.
Boosted by these developments and the competitiveness of India’s industry of late has given the external sector the necessary strength. The fact that India shows a comparative advantage (RCA > 1) in 43 commodities constituting 68% of its merchandise export portfolio and that India has negotiated hard under the WTO for itself speaks about its rising power in international trade.
Besides, opening up of the economy to FDI has made it a global hub in several sectors, its bilateral and regional FTAs have provided it with the much-needed geographical diversification. All these are reflected in the fact that its share in global services trade has doubled in less than 20 years between 2005-2023 making it the seventh largest country.
ISPP is also of the view that gone are times when a trading partner dictated terms of trade in bilateral trade, even if it was the largest trading partner. Anup Wadhawan, former Commerce Secretary to the Government of India, and faculty at ISPP at a recent lecture at ISPP said that protectionism hinders the benefits of comparative advantage and economies of scale, ultimately making a country uncompetitive and decoupling it from vital Global Value Chains46.
Moreover, India now banks on the economics of buying relatively cheaper crude oil (a commodity on which it has highest import dependency) from Russia rather than getting pressured by the politics of the US (largest trading partner) through high tariffs threats and creating roadblocks in the bilateral trade agreement.
Contributed by ISPP faculty and scholars.
Scholars include Bhumika Dhoundiyal, Gargi Dave , Nandipati Sarat Chandra , Baldeep Singh, Pragya Saini, Ashi Bajpai, Subodh, Aishwarya V , Pushpali Goswami, Nalin Sharma.
FAQs
References:
- https://www.mea.gov.in/bilateral-documents.htm?dtl/40410
- https://www.pib.gov.in/PressReleasePage.aspx?PRID=2198621®=3&lang=2
- DGCIS data: https://www.dgciskol.gov.in/writereaddata/Downloads/20250819155439A%20Quick%20View%20of%20Indias%20Trade%20Scenario.pdf
- Economic Survey 2024-25https://www.indiabudget.gov.in/economicsurvey/doc/echapter.pdf
- https://www.pib.gov.in/PressReleasePage.aspx?PRID=2201284®=3&lang=1
- https://www.pib.gov.in/PressReleasePage.aspx?PRID=2201284®=3&lang=1
- The Economic Times https://economictimes.indiatimes.com/news/economy/foreign-trade/indias-electronics-exports-hit-24-month-high-at-usd-3-58-bn-in-dec/articleshow/117271942.cms?from=mdr
- https://www.pib.gov.in/PressReleasePage.aspx?PRID=2097911®=3&lang=2
- https://oec.world/en/profile/country/ind#bespoke-title-339
- https://www.niti.gov.in/sites/default/files/2024-12/Trade-Watch.pdf
- https://static.pib.gov.in/WriteReadData/specificdocs/documents/2025/apr/doc2025416540601.pdf
- https://static.pib.gov.in/WriteReadData/specificdocs/documents/2025/apr/doc2025416540601.pdf
- https://static.pib.gov.in/WriteReadData/specificdocs/documents/2025/apr/doc2025416540601.pdf
- https://static.pib.gov.in/WriteReadData/specificdocs/documents/2025/apr/doc2025416540601.pdf
- https://static.pib.gov.in/WriteReadData/specificdocs/documents/2025/apr/doc2025416540601.pdf
- https://www.pib.gov.in/PressReleasePage.aspx?PRID=2098447®=3&lang=2
- https://www.investindia.gov.in/team-india-blogs/make-india-world-top-exports-fueling-indias-growth-story
- https://www.pib.gov.in/PressReleasePage.aspx?PRID=2098447®=3&lang=2
- https://indiantradeportal.in/vs.jsp?lang=0&id=0,31,24100,29404
- https://www.indiabudget.gov.in/economicsurvey/doc/eschapter/echap08.pdf
- https://www.indiabudget.gov.in/economicsurvey/doc/eschapter/echap08.pdf
- https://www.niti.gov.in/sites/default/files/2024-12/Trade-Watch.pdf
- https://www.niti.gov.in/sites/default/files/2024-12/Trade-Watch.pdf
- https://www.niti.gov.in/sites/default/files/2024-12/Trade-Watch.pdf
- https://www.niti.gov.in/sites/default/files/2024-12/Trade-Watch.pdf
- https://www.niti.gov.in/sites/default/files/2024-12/Trade-Watch.pdf
- https://www.niti.gov.in/sites/default/files/2024-12/Trade-Watch.pdf
- https://www.pib.gov.in/PressNoteDetails.aspx?NoteId=154945&ModuleId=3®=3&lang=2
- https://www.pib.gov.in/PressReleasePage.aspx?PRID=2190478®=3&lang=2
- https://csep.org/working-paper/servicification-of-manufacturing-indias-potential-and-policy-priorities/
- https://www.icra.in/Research/ViewResearchReport/india-saw-highest-ever-trade-deficit-in-october-2025-likely-dip-in-gold-imports-higher-exports-to-cool-deficit-prints-during-november-december/6627
- https://www.pib.gov.in/PressReleaseIframePage.aspx?PRID=2017942®=3&lang=2
- https://www.pib.gov.in/PressReleasePage.aspx?PRID=2098447®=3&lang=2
- https://csep.org/working-paper/working-paper-trade-policy-reform-in-india-since-1991/
- https://csep.org/working-paper/working-paper-trade-policy-reform-in-india-since-1991/
- https://www.indiabudget.gov.in/doc/bspeech/bs199192.pdf
- https://mlsu.ac.in/econtents/2369_Economic%20Policy-1991-converted.pdf
- https://www.dpiit.gov.in/static/uploads/2025/12/455f17dc8382e1ad8c910669d486e309.pdf
- https://www.pib.gov.in/PressReleasePage.aspx?PRID=2121826®=3&lang=2
- https://ijrpr.com/uploads/V5ISSUE11/IJRPR34924.pdf
- https://ijrpr.com/uploads/V5ISSUE11/IJRPR34924.pdf
- https://ijrpr.com/uploads/V5ISSUE11/IJRPR34924.pdf
- https://www.pib.gov.in/PressNoteDetails.aspx?id=156567&NoteId=156567&ModuleId=3®=3&lang=2
- https://www.pib.gov.in/PressNoteDetails.aspx?id=156567&NoteId=156567&ModuleId=3®=3&lang=2
- https://www.pib.gov.in/PressNoteDetails.aspx?id=156567&NoteId=156567&ModuleId=3®=3&lang=2
- https://www.ispp.org.in/tariffs-trade-wars-and-the-indispensable-future-of-globalisation/